The party with the most votes has not necessarily won the election. Instead parties are forced to form coalitions.
In political systems like Germany, where we have no party getting anything near 50% of the votes, the usual one-bar-per-party bar charts (shown on the right) totally fail answering this most important question.
The alternative visualization below fixes this!
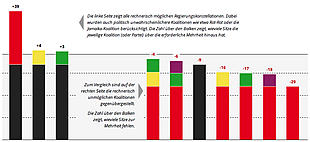
On the right the impossible coalitions are shown for comparison.
The numbers above the bars show how many seats are missing for a majority.
* Select election forecast:
ARD / Infratest Dimap:
23:20
22:47
22:19
21:45
21:09
19:54
19:20
19:05
18:37
18:13
ZDF / Forschungsgr. Wahlen:
22:51
21:45
20:55
20:09
19:39
19:23
19:01
18:45
18:16